AI that ships, stays stable, and pays for itself
If you own revenue, support, or operations, you do not need another AI demo. You need live assistants and automations tied to clear metrics like fewer tickets, better-qualified leads, and hours saved for your team.
BYBOWU is an AI and product development partner based in Phoenix, AZ, working with SaaS, ecommerce, and B2B teams across the US and worldwide. We design and build AI agents, chatbots, and private LLM integrations that connect to your existing stack and hold up in production.
Where AI projects usually go off the rails
Most teams have already experimented with AI. The patterns are familiar:
- Widget-style chatbots that cannot handle real questions, go off-brand, or escalate almost everything to humans.
- Manual copy-paste between tools because support, CRM, billing, and analytics are not part of one flow.
- Pilots that stay in a sandbox, never touch your product or website, and quietly die after one quarter.
- Real concerns about sending sensitive data to public APIs without controls, logging, or an audit trail.
- Engineering teams already at capacity, with nobody owning AI architecture, evaluation, or guardrails.
Our job is to cut through the noise, pick a few use cases that clearly move a number you care about, and get them into production without turning your stack into a science project.
What we actually design and build
We are not trying to replace your team with AI. We focus on assistants, automations, and analytics that make your people more effective and your product more useful.
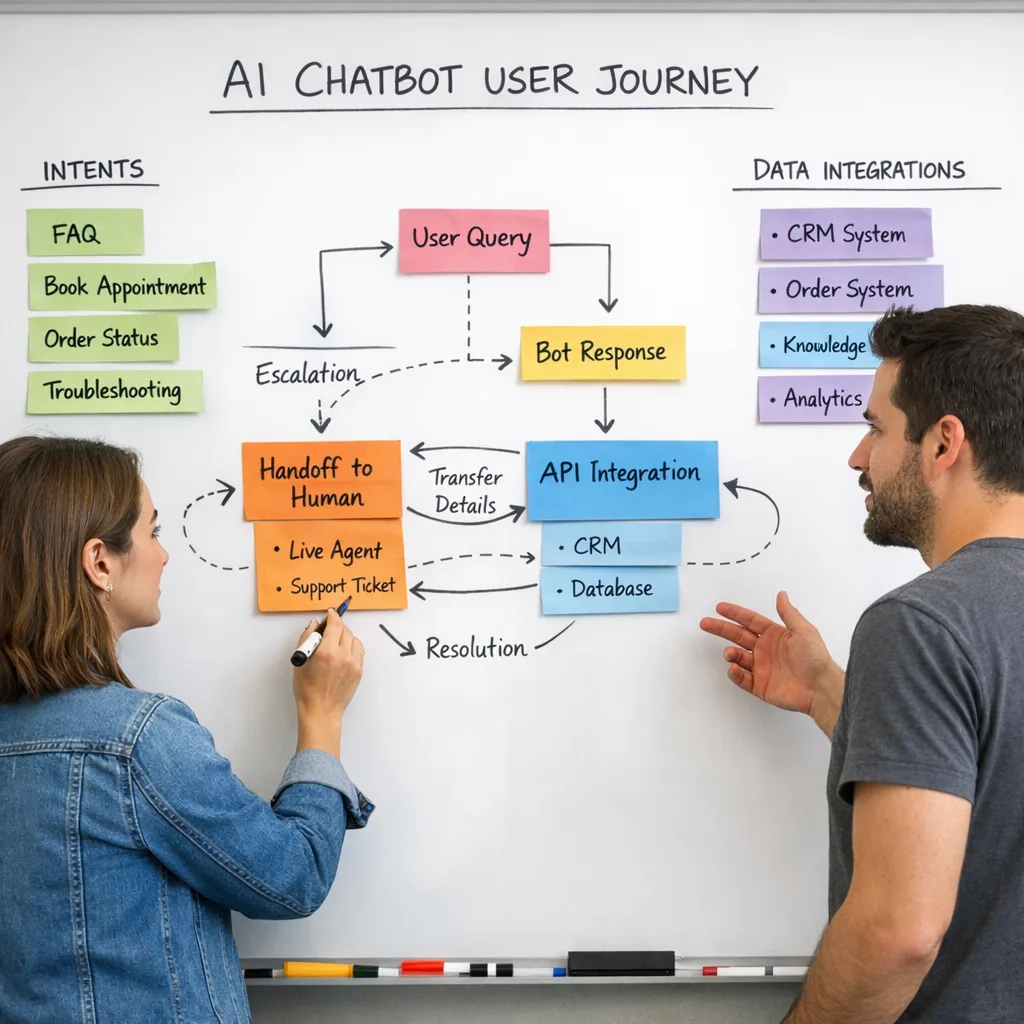
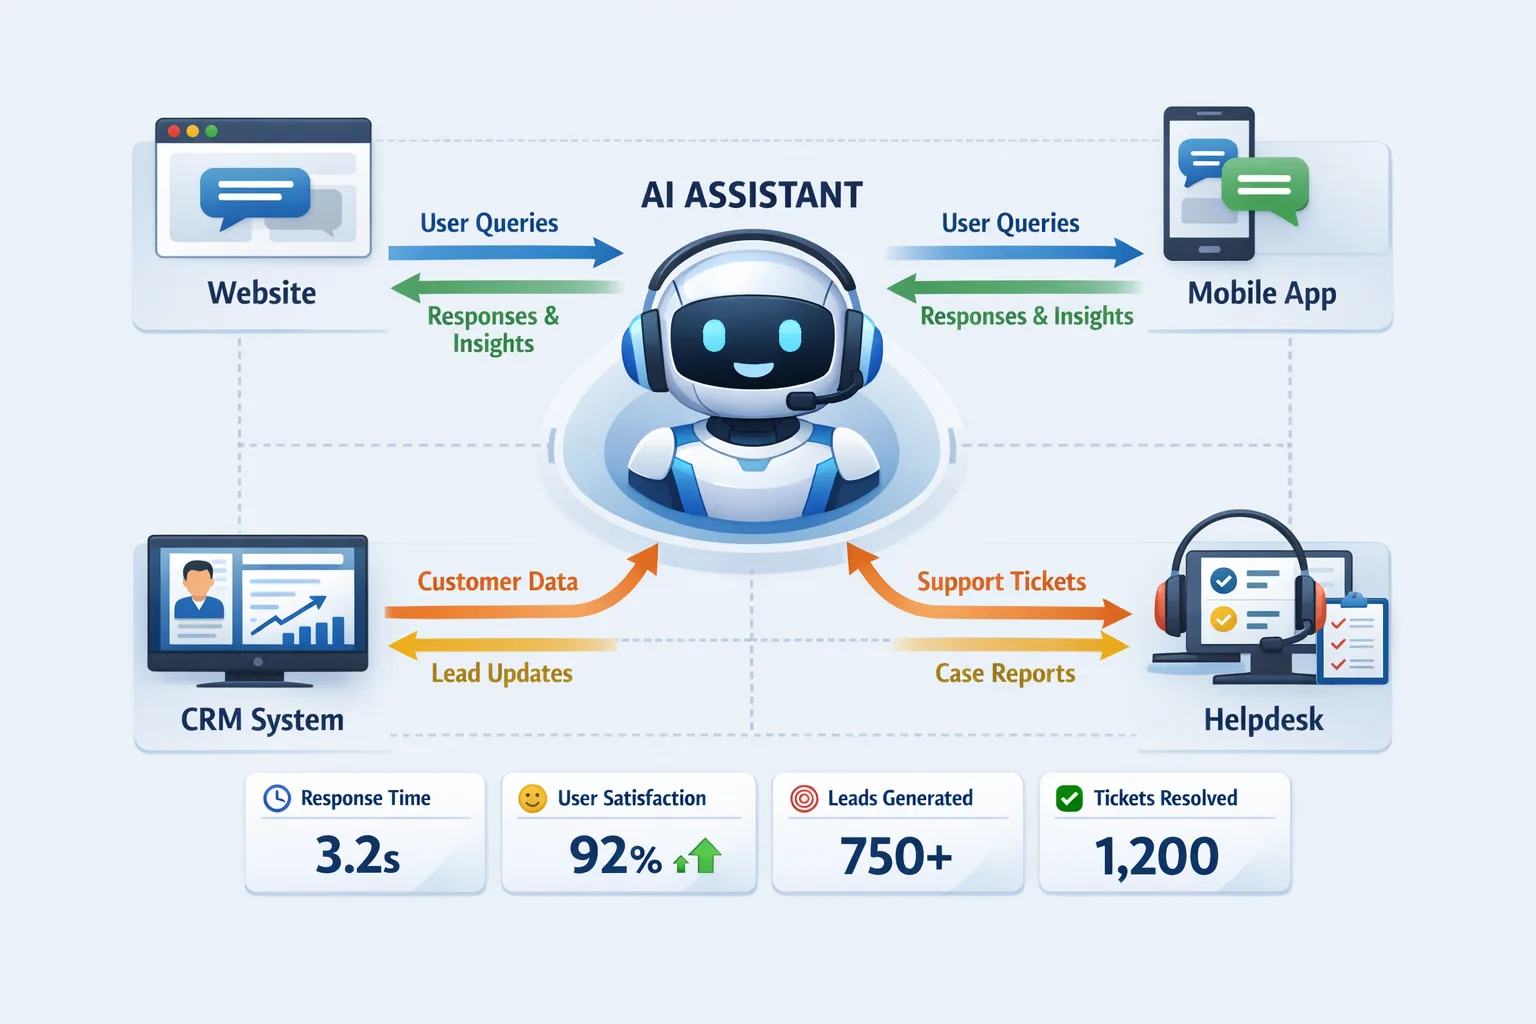
- AI chatbots and virtual agents for web and mobile, built as custom AI chatbots that answer questions, collect details, and hand off to humans cleanly.
- AI customer support automation to deflect FAQs and routine tickets using AI support automation and FAQ chatbots wired into your helpdesk and knowledge base.
- Private LLM assistants and enterprise integrations through custom LLM integration, RAG implementation, and secure access to CRMs, dashboards, and internal portals.
- AI content and marketing tools using AI content generation workflows so your team can draft, review, and approve at scale without losing brand voice.
- Recommendations and personalization for ecommerce and SaaS with an AI recommendation engine and AI-based personalization that adapts content and offers in real time.
- Predictive analytics for ecommerce and sales using AI predictive analytics to turn order history and behavior into forecasts, churn signals, and alerts your team can act on.
- Voice and multimodal experiences via AI voice assistant integration when speaking is faster than typing, especially for support and internal tools.
- Lead and data automation with AI-powered forms and surveys, AI lead tools, and customer journey analytics.
Get a 24-hour AI opportunity assessment
Share your product, data sources, and business goals. Within one business day we will outline concrete AI use cases, a rough timeline, and a realistic budget range you can react to.
How we run AI projects, start to finish
We treat AI work like any other production build: clear scope, senior ownership, and a path to real users from day one.
1. Discovery and use case selection
We start with a focused session on your workflows, stack, and KPIs. Together we select two or three use cases that can pay for themselves quickly, such as deflecting first-line support tickets, qualifying leads before sales calls, or speeding up content creation.
2. Architecture and model decisions
We design the system around your constraints and risk profile. That includes whether to use hosted models via services like OpenAI API integration, open-source models, or a mix. We decide how to structure retrieval and vector search with vector database setup, and how AI will interact with your web or mobile apps, backends, and data stores.
3. Build, training, and evaluation
We connect your data, implement retrieval-augmented generation where needed, and define prompts, tools, and guardrails. Then we test against real examples from your team, not just synthetic benchmarks.
- Accuracy checks with subject-matter experts so responses match how you actually talk and work.
- Load and latency tests so response times hold up under your traffic patterns.
- Safety, compliance, and edge-case checks, often supported by our model evaluation and guardrails specialists.
4. Deployment and integration
We deploy to staging and production, connect to your CRM, CMS, helpdesk, analytics, or custom backend, and roll out gradually so you can compare before and after impact with real data.
5. Monitoring, optimization, and next phases
We instrument the system for usage, satisfaction, and business KPIs such as ticket volume, first-response time, lead quality, or repeat purchase behavior. From there we refine prompts and flows, tighten guardrails, and plan the next use cases once the first ones have proven their value.
- Discovery and planning: 1–2 weeks
- Model and feature build: 2–6 weeks
- Integration and launch: 1–3 weeks
Focused chatbots and assistants can launch faster. Complex multi-system or analytics projects can take longer. We agree on scope, milestones, and launch windows with you before kickoff.
What you can order
- AI FAQ and support chatbot MVP — A production-ready FAQ or support bot for your site or app, trained on your docs, connected to your helpdesk, with clean handoff to agents and basic reporting.
- AI sales and lead qualification assistant — An on-site or in-app assistant that asks qualifying questions, scores leads, writes call notes, and syncs everything to your CRM using AI lead qualification and CRM integrations.
- Private LLM knowledge assistant for your team — An internal assistant for documentation, tickets, and specs with access control, logging, and safe handling of sensitive data, deployed inside your infrastructure when needed.
- Ecommerce personalization and recommendations layer — Product and content recommendations plus personalized blocks across your store to lift average order value and repeat purchases, integrated with your existing ecommerce platform.
- AI content and email co-pilot — A set of workflows and tools around AI content generation and AI email automation so your team can draft, review, and approve campaigns faster.
- Predictive analytics and alerts module — A focused AI forecasting module inside your existing dashboards that flags demand, churn, or sales signals before they become issues.
Why choose BYBOWU for AI development
- Product-first, not toy demos — We come from web, app, and SaaS development, so every AI initiative ties back to UX, conversion, and operational efficiency, not just model scores.
- Senior ownership and honest tradeoffs — You work with people who can talk business and engineering in the same conversation. We are direct about costs, risks, and what should be phase one versus later.
- Data security and control built in — We design architectures with proper access control, encryption, logging, and separation between PII and model inputs where your policies require it.
- Vendor-agnostic, future-ready design — Models and providers change quickly. We build modular systems so you can swap vendors or extend use cases without starting from scratch.
- End-to-end delivery when you need it — When projects call for more, we involve our web development, mobile app, data engineering, or DevOps & cloud teams to handle the full product, not just the AI piece.
Security, compliance, and reliability by default
Any AI that touches customers or sensitive data needs the same discipline as the rest of your production stack. We design for that from the start.
- Role-based access control and encryption in transit and at rest where appropriate.
- Clear separation between personally identifiable information and model inputs when your policies require it.
- Monitoring, logging, and evaluation so you can see what the AI did, why, and where it might be going wrong.
- Architectures and patterns aligned with your industry standards and internal security guidelines.
If you already work with us on web development, mobile apps, or support and maintenance, we can extend those systems with AI without disrupting what is already working.
Proof it works in the real world
Support assistant for a fashion marketplace
For a modern clothing marketplace similar to SixZeros and BEZET, we implemented an assistant to handle common questions around orders and shipping so human agents could focus on edge cases and higher-value conversations.
Guided onboarding for a roommate-finder app
On a roommate-finder product similar to Roome, we helped streamline onboarding with contextual guidance and smart prompts, reducing friction and day-one support requests.
Automation for ecommerce operations
For a dropshipping and wholesale setup similar to MonoDrop, we built automation around product data and orders, improving consistency and reducing manual work for internal teams.
Conversational experiences on messaging platforms
In projects like our Telegram bots work, we designed conversational flows integrated with business logic, a foundation we now extend with AI for more natural, helpful interactions.
Questions founders usually ask
What budget range should we expect?
Focused pilots such as an FAQ chatbot connected to an existing knowledge base typically sit around the same range as a well-defined feature build. Larger initiatives, like private LLM assistants or multi-channel automation, are closer to a full product module. After a short call we can give you a range that matches your scope instead of a generic guess, and you can also review typical brackets on our Prices page.
Do we need a data science team on our side?
No. It helps to have someone who understands your domain, data, and workflows, but we handle model selection, evaluation, and infrastructure. Your team focuses on goals and feedback, we take care of the engineering and delivery.
Can you integrate with our current tools?
Yes. We routinely connect AI systems to CRMs, helpdesks, CMSs, analytics, and custom backends, including stacks we did not build. When needed, we extend products through our custom software development and integrations and API services so the AI work fits cleanly into your architecture.
How do we measure if AI is actually working?
We define success metrics up front. Typical examples include ticket deflection rate, time saved per interaction, lift in qualified leads, shorter sales cycles, or changes in repeat purchase behavior. We then implement tracking so you can see impact in your existing analytics, not just inside a separate AI dashboard.
What about privacy and regulatory requirements?
We design around your compliance needs and preferred data regions. That can mean choosing specific providers, isolating sensitive data from prompts, using open-source models deployed in your own environment, and implementing stricter logging and retention controls. We explain the tradeoffs in plain language before you commit.
We are outside the US. Is that a problem?
No. While our team is headquartered in Arizona, most AI projects are delivered remotely for clients across the US and internationally. We run projects over video calls and async tools, with clear documentation and regular check-ins to keep everyone aligned across time zones.
Next step: turn AI ideas into a concrete plan
If you already have a specific AI use case in mind, we can start there. If you are still deciding where AI will move the needle most, we will help you prioritize based on effort, risk, and potential impact.
Share your goals, constraints, and timing, and we will come back with a practical proposal, rough budget, and timeline you can review with your team.
Contact us for a 24-hour AI proposal or, if you prefer to start from your existing site or app, request a focused review through our web development team.